Cari dalam skrip untuk "relative strength"

RSI with StochRSI CrossesRelative strength index plotted with arrow up/down to indicate StochRSI crossovers.
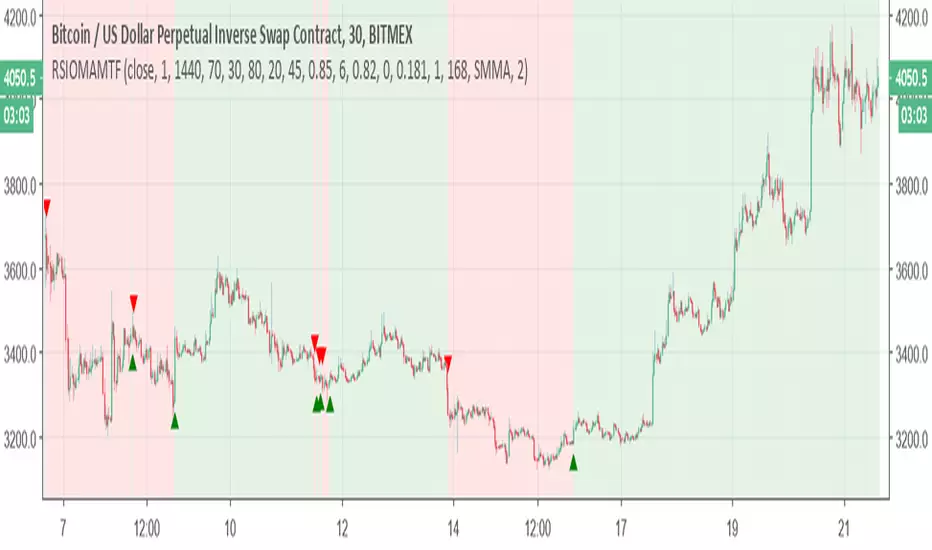
Relative Strength Index of Moving Average MTF alertsAll credit to this study is for chris jhoncic , this is MTF version with alert of his study
basic idea is hybrid of RSI and different MA
You can choose which MA from the following list:
Tillson Moving Average (T3)
Double Exponential Moving Average ( DEMA )
Arnaud Legoux Moving Average ( ALMA )
Least Squares Moving Average ( LSMA )
Simple Moving Average ( SMA )
Exponential Moving Average ( EMA )
Weighted Moving Average ( WMA )
Smoothed Moving Average ( SMMA )
Triple Exponential Moving Average ( TEMA )
Hull Moving Average ( HMA )
Adaptive moving average (AMA)
Fractal Adaptive Moving Average (FAMA)
Variable Index Dynamic Average ( VIDYA )
Triangular Moving Average (TRIMA)
to change the time frame change int2 to what you desire
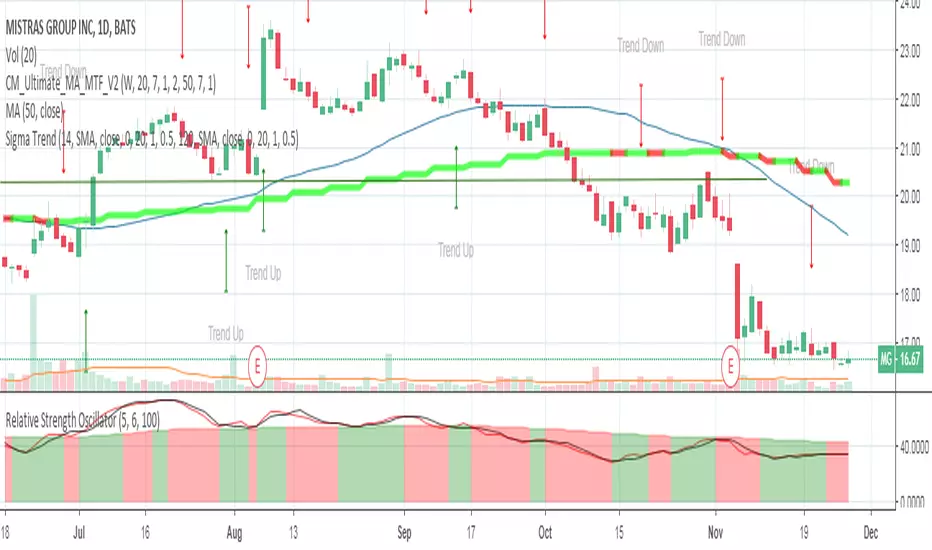
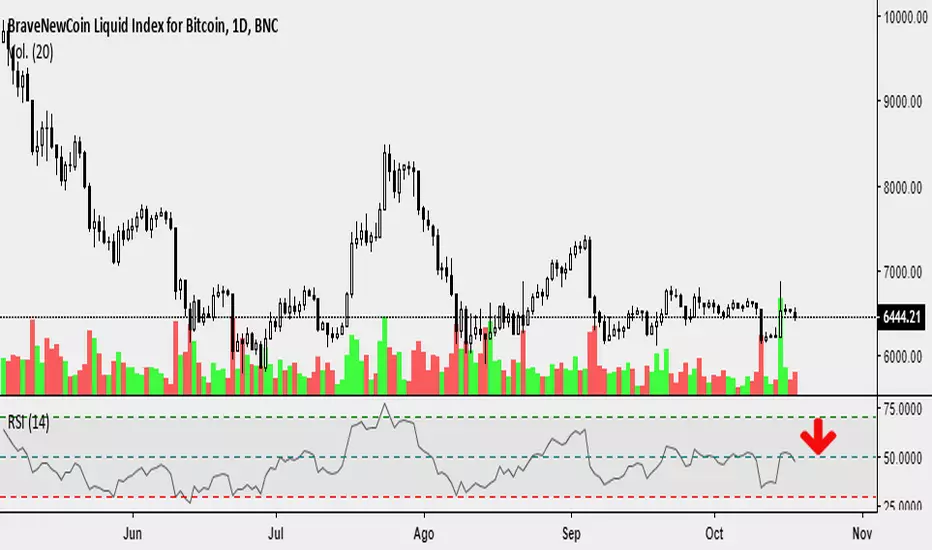
Relative Strength Index Divergence MarkFeatures:
Bright & Dark theme option. Choose the type that you can see clearly.
Customizable RSI length parameters.
Mark all the RSI Divergence signals on your chart!
Highlight bar color for divergence signals.
Getting Started:
Replace your RSI indicator with this one.
You can add divergence alarms of any time frame!
Contributing:
You can report bugs or issues under this page.
Any advice would be helpful for improving this indicator's accuracy.
Application:
This is an invite only indicator.

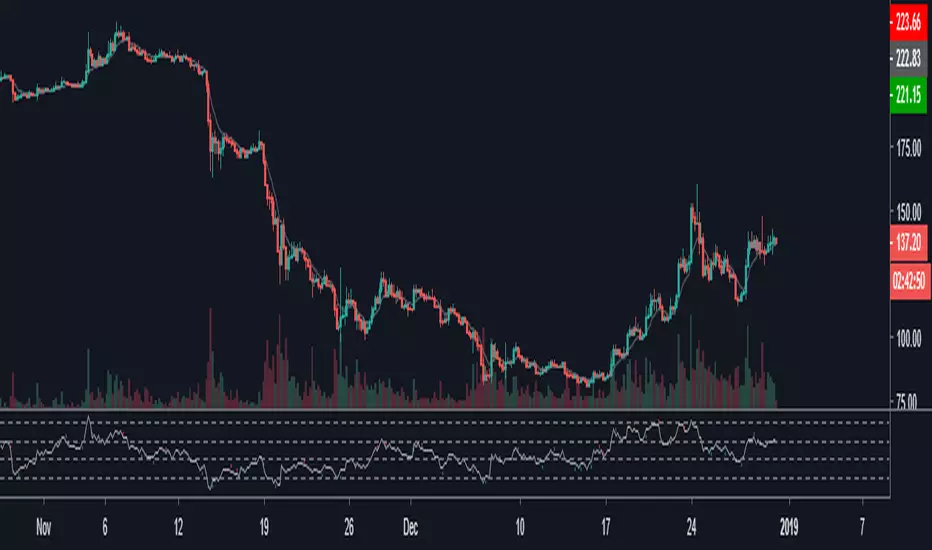
Relative Strength OscillatorTracks an EMA and SMA of the 14 day RSI. Also avoids the market with 14 day RSI is above 90.
Buy when green, sell when red.
Relative Strength Index with Averageadds an avg input to smooth the RSI. Helps with determining tend-direction at a glance

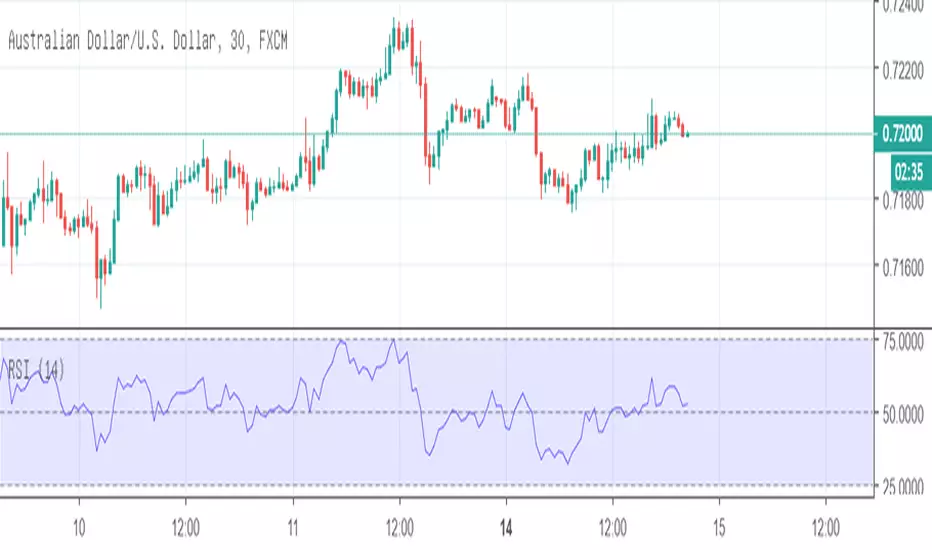
Relative Strength Index Line 50The only variant to the original is that it has the average line of 50.
Relative Strength Index 50 LineSuper simple script that just adds a line at the 50 level for the RSI.
Relative Strength Index - Divergences - LibertusHello all,
To ease everyone's trading experience I made this script which colors RSI overbought and oversold conditions and as a bonus displays bullish or bearish divergences in last 50 candles (by default, you can change it).
Script is open source, part of code is from Trading View examples. If you have suggestions or you already made some improvements, please report in comment.
Happy trading and good luck!

Relative Strength Index With 2 Moving Averages of RSIThis has the regular RSI and then two moving averages of RSI. Used by the Unconventional RSI Followers (Andrew Cardwell students).


Relative Strength (MA) to Indexagainst USD.
Application:
- Over or under performance
- Divergence indication

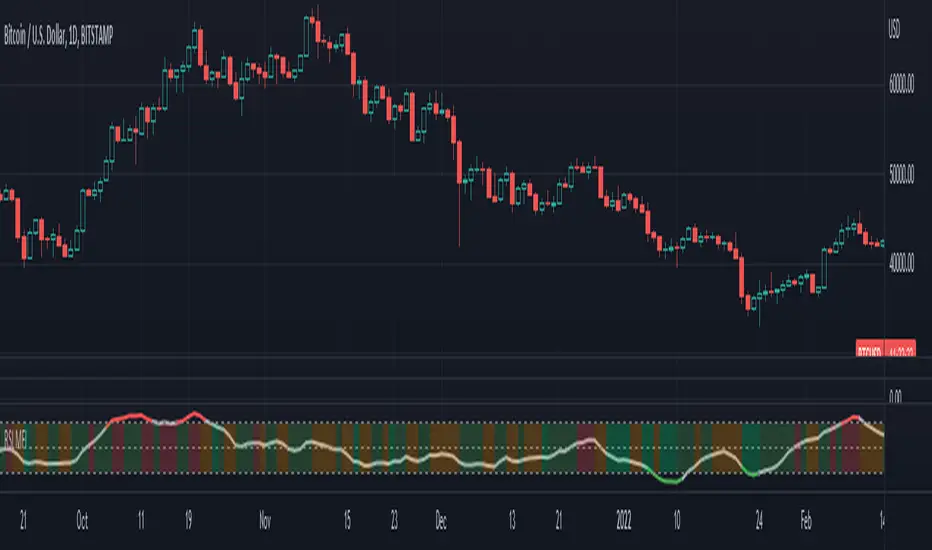
Relative Strength Index/Money Flow IndexCombines a RSI and MFI with an EMA to smooth out signal can show otherwise unseen divergence